fairlearn.postprocessing.plot_threshold_optimizer#
- fairlearn.postprocessing.plot_threshold_optimizer(threshold_optimizer, ax=None, show_plot=True)[source]#
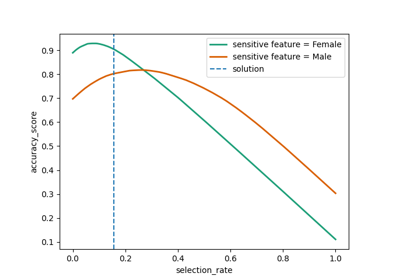
Plot the chosen solution of the threshold optimizer.
For
ThresholdOptimizerobjects that have their constraint set todemographic_paritythis will result in a selection/error curve plot. ForThresholdOptimizerobjects that have their constraint set toequalized_oddsthis will result in a ROC curve plot.Added in version 0.4.5.
- Parameters:
- threshold_optimizer
ThresholdOptimizer The ThresholdOptimizer instance for which the results should be illustrated.
- ax
matplotlib.axes.Axes, default =None A custom matplotlib.axes.Axes object to use for the plots.
- show_plotbool, default =
True Whether or not the generated plot should be shown, default True
- threshold_optimizer