Note
Go to the end to download the full example code. or to run this example in your browser via JupyterLite
Value counts#
import matplotlib.pyplot as plt

from fairlearn.datasets import fetch_diabetes_hospital
fig, ax = plt.subplots()

data = fetch_diabetes_hospital(as_frame=True)
X = data.data.copy()
X.drop(columns=["readmitted", "readmit_binary"], inplace=True)
y_true = data.target
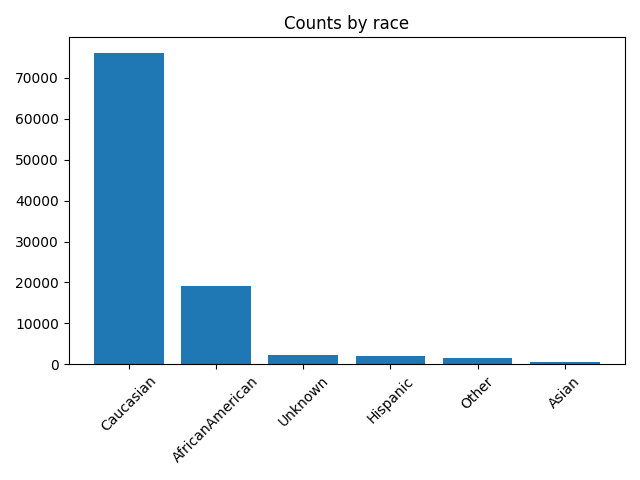
race = X["race"]

df = race.value_counts().reset_index()

ax.bar(df["race"], df["count"])
ax.set_title("Counts by race")
ax.tick_params(axis="x", labelrotation=45)

plt.tight_layout()
plt.show()

Total running time of the script: (0 minutes 1.098 seconds)
Estimated memory usage: 179 MB