

Note
Go to the end to download the full example code. or to run this example in your browser via JupyterLite
Credit Loan Decisions#
Package Imports#
import warnings

import lightgbm as lgb
import matplotlib.pyplot as plt
import numpy as np
import pandas as pd
from sklearn.metrics import balanced_accuracy_score, confusion_matrix, roc_auc_score
from sklearn.model_selection import train_test_split
from sklearn.pipeline import Pipeline
from sklearn.preprocessing import StandardScaler

from fairlearn.metrics import (
    MetricFrame,
    count,
    equalized_odds_difference,
    false_negative_rate,
    false_positive_rate,
    selection_rate,
)
from fairlearn.postprocessing import ThresholdOptimizer
from fairlearn.reductions import EqualizedOdds, ExponentiatedGradient

warnings.simplefilter("ignore")

rand_seed = 1234
np.random.seed(rand_seed)
Fairness considerations of credit loan decisions#
Fairness and credit lending in the US#
In 2019, Apple received backlash on social media after its newly launched Apple Card product appeared to offer higher credit limits to men compared to women [1]. In multiple cases, married couples found the husband received a credit limit that was 10-20x higher than the wife’s even when the couple had joint assets.
From a regulatory perspective, financial institutions that operate within the United States are subject to legal regulations prohibiting discrimination on the basis of race, gender, or other protected classes [2]. With the increasing prevalence of automated decision-systems in the financial lending space, experts have raised concerns about whether these systems could exacerabate existing inequalities in financial lending.
Although the two concepts are intertwined, algorithmic fairness is not the same concept as anti-discrimination law. An AI system can comply with anti-discrimination law while exhibiting fairness-related concerns. On the other hand, some fairness interventions may be illegal under anti-discrimination law. Xiang and Raji[3] discuss the compatibilities and disconnects between anti-discrimination law and algorithmic notions of fairness. In this case study, we focus on fairness in financial services rather than compliance with financial anti-discrimination regulations.
Ernst & Young (EY) case study#
In this case study, we aim to replicate the work done in a white paper [4], co-authored by Microsoft and EY, on mitigating gender-related performance disparities in financial lending decisions. In their analysis, Microsoft and EY demonstrated how Fairlearn could be used to measure and mitigate unfairness in the loan adjudication process.
Using a dataset of credit loan outcomes (whether an individual defaulted on a credit loan), we train a fairness-unaware model to predict the likelihood an individual will default on a given loan. We use the Fairlearn toolkit for assessing the fairness of our model, according to several metrics. Finally, we perform two unfairness mitigation strategies on our model and compare the results to our original model.
Because the dataset used in the white paper is not publicly available, we will introduce a semi-synthetic feature into an existing publicly available dataset to replicate the outcome disparity found in the original dataset.
Credit decisions dataset#
As mentioned, we will not be able to use the original loans dataset, and instead will be working with a publicly available dataset of credit card defaults in Taiwan collected in 2005. This dataset represents binary credit card default outcomes for 30,000 applicants with information pertaining to an applicant’s payment history and bill statements over a six-month period from April 2005 to September 2005, as well as demographic information, such as sex, age, marital status, and education level of the applicant. A full summary of features is provided below:
features |
description |
|---|---|
sex, education, marriage, age |
demographic features |
pay_0, pay_2, pay_3, pay_4, pay_5, pay_6 |
repayment status (ordinal) |
bill_amt1, bill_amt2, bill_amt3, bill_amt4, bill_amt5, bill_amt_6 |
bill statement amount (Taiwan dollars) |
pay_amt1, pay_amt2, pay_amt3, pay_amt4, pay_amt5, pay_amt6 |
previous statement amount (Taiwan dollars) |
default payment next month |
default information (1 = YES, 0 = NO) |
Let’s pretend we are a data scientist at a financial institution who is tasked with developing a classification model to predict whether an applicant will default on a personal loan. A positive prediction by the model means the applicant would default on the credit loan. Defaulting on a loan means the client fails to make payments within a 30-day window, and the lender can take legal actions against the client.
Although we do not have a dataset of loan default history, we do have this data set of credit card payment history. We assume customers who make monthly credit card payments on time are more creditworthy, and thus less likely to default on a personal credit loan.
Decision point: task definition
Defaulting on a credit card payment can be viewed as a proxy for the fact that an applicant might not be a good candidate for a personal loan.
Because most customers did not default on their credit card payment, we will need to take this class imbalance into account during our modeling process.
As the data is read in-memory, we will change the column PAY_0 to
PAY_1 to make the naming more consistent with the naming of the
other columns.
In addition, the target variable default payment next month is
changed to default to reduce verbosity.
data_url = "http://archive.ics.uci.edu/ml/machine-learning-databases/00350/default%20of%20credit%20card%20clients.xls"
dataset = (
    pd.read_excel(io=data_url, header=1)
    .drop(columns=["ID"])
    .rename(columns={"PAY_0": "PAY_1", "default payment next month": "default"})
)

dataset.shape
(30000, 24)
From the dataset description [5], we see there are three categorical features:
SEX: Sex of the applicant (as a binary feature)EDUCATION: Highest level of education achieved by the applicant.MARRIAGE: Marital status of the applicant.
categorical_features = ["SEX", "EDUCATION", "MARRIAGE"]

for col_name in categorical_features:
    dataset[col_name] = dataset[col_name].astype("category")

Y, A = dataset.loc[:, "default"], dataset.loc[:, "SEX"]
X = pd.get_dummies(dataset.drop(columns=["default", "SEX"]))

A_str = A.map({1: "male", 2: "female"})
Dataset imbalances#
Before we start training a classifier model, we want to explore the
dataset for any characteristics that may lead to fairness-related harms
later on in the modeling process.
In particular, we will focus on the distribution of sensitive feature
SEX and the target label default.
As part of an exploratory data analysis, let’s explore the distribution of
our sensitive feature SEX. We see that 60% of loan applicants were
labeled as female and 40% as male, so we do not need to worry about
imbalance in this feature.
A_str.value_counts(normalize=True)
SEX
female    0.603733
male      0.396267
Name: proportion, dtype: float64
Next, let’s explore the distribution of the loan default rate Y.
We see that around 78% of individuals in the dataset do not default on their
credit loan. While the target label does not display extreme imbalance, we
will need to account for this imbalance in our modeling section. As opposed
to the sensitive feature SEX, an imbalance in the target label may
result in a classifier that over-optimizes for the majority class.
For example, a classifier that predicts an applicant will not default would
achieve an accuracy of 78%, so we will use the balanced_accuracy
score as our evaluation metric to counteract the label imbalance.
Y.value_counts(normalize=True)
default
0    0.7788
1    0.2212
Name: proportion, dtype: float64
Check if this will lead to disparity in naive model#
Now that we have created our synthetic feature, let’s check how this new
feature interacts with our sensitive_feature Sex and our target
label default.
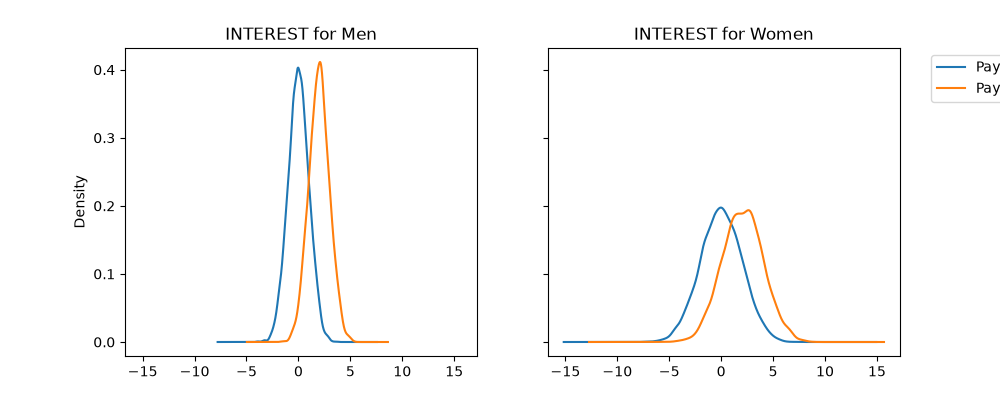
We see that for both sexes, the Interest feature is higher for
individuals who defaulted on their loan.
fig, (ax_1, ax_2) = plt.subplots(ncols=2, figsize=(10, 4), sharex=True, sharey=True)
X["Interest"][(A == 1) & (Y == 0)].plot(
    kind="kde", label="Payment on Time", ax=ax_1, title="INTEREST for Men"
)
X["Interest"][(A == 1) & (Y == 1)].plot(kind="kde", label="Payment Default", ax=ax_1)
X["Interest"][(A == 2) & (Y == 0)].plot(
    kind="kde",
    label="Payment on Time",
    ax=ax_2,
    legend=True,
    title="INTEREST for Women",
)
X["Interest"][(A == 2) & (Y == 1)].plot(
    kind="kde", label="Payment Default", ax=ax_2, legend=True
).legend(bbox_to_anchor=(1.6, 1))
<matplotlib.legend.Legend object at 0x7dbc2bda94f0>
Training an initial model#
In this section, we will train a fairness-unaware model on the training data. However because of the imbalances in the dataset, we will first resample the training data to produce a new balanced training dataset.
def resample_training_data(X_train, Y_train, A_train):
    """Down-sample the majority class in the training dataset to produce a
    balanced dataset with a 50/50 split in the predictive labels.

    Parameters:
    X_train: The training split of the features
    Y_train: The training split of the target labels
    A_train: The training split of the sensitive features

    Returns:
    Tuple of X_train, Y_train, A_train where each dataset has been re-balanced.
    """
    negative_ids = Y_train[Y_train == 0].index
    positive_ids = Y_train[Y_train == 1].index
    balanced_ids = positive_ids.union(np.random.choice(a=negative_ids, size=len(positive_ids)))

    X_train = X_train.loc[balanced_ids, :]
    Y_train = Y_train.loc[balanced_ids]
    A_train = A_train.loc[balanced_ids]
    return X_train, Y_train, A_train
At this stage, we will train a gradient-boosted tree classifier using the
lightgbm package on the balanced training dataset.
When we evaluate the model, we will use the unbalanced testing dataset.
lgb_params = {
    "objective": "binary",
    "metric": "auc",
    "learning_rate": 0.03,
    "num_leaves": 10,
    "max_depth": 3,
    "random_state": rand_seed,
    "n_jobs": 1,
    "verbose": -1,
}

estimator = Pipeline(
    steps=[
        ("preprocessing", StandardScaler()),
        ("classifier", lgb.LGBMClassifier(**lgb_params)),
    ]
)

estimator.fit(X_train, y_train)
We compute the binary predictions and the prediction probabilities for the testing data points.
From the ROC Score, we see the model appears to be differentiating
between true positives and false positives well.
This is to be expected given the INTEREST feature provides a
strong discriminant feature for the classification task.
0.8782234705862874
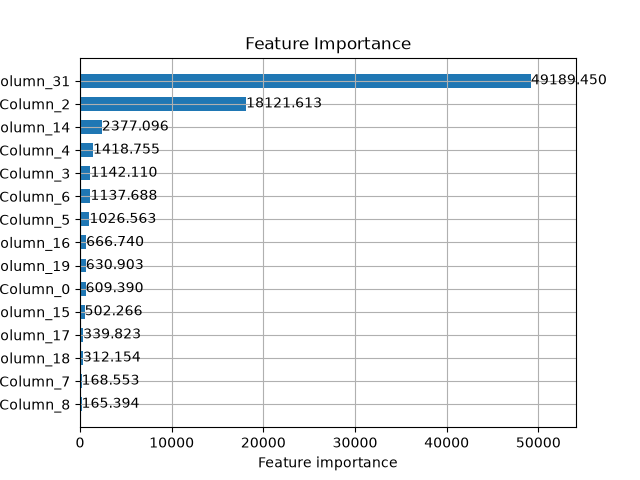
Feature Importance of the Unmitigated Classifier#
As a model validation check, let’s explore the feature importances of our
classifier.
As expected, our synthetic feature INTEREST has the highest feature
importance because it is highly correlated with the target variable,
by construction.
lgb.plot_importance(
    estimator.named_steps["classifier"],
    height=0.6,
    title="Feature Importance",
    importance_type="gain",
    max_num_features=15,
)
<Axes: title={'center': 'Feature Importance'}, xlabel='Feature importance', ylabel='Features'>
Fairness assessment of unmitigated model#
Now that we have trained our initial fairness-unaware model, let’s perform our fairness assessment for this model. When conducting a fairness assessment, there are three main steps we want to perform:
Identify who will be harmed.
Identify the types of harms we anticipate.
Define fairness metrics based on the anticipated harms.
Who will be harmed?#
Based on the incident with Apple credit card mentioned at the beginning of this notebook, we believe the model may incorrectly predict women will default on the credit loan. The system may unfairly allocate less loans to women and over-allocate loans to men.
Types of harm experienced#
When discussing fairness in AI systems, the first step is understanding what types of harms we anticipate the system may produce. Using the harms taxonomy in the Fairlearn User Guide, we expect this system to produce harms of allocation. In addition, we also anticipate the long-term impact on an individual’s credit score if an individual is unable to repay a loan they receive or if they are rejected for a loan application. A harm of allocation occurs when an AI system extends or withholds resources, opportunities, information. In this scenario, the AI system is extending or withholding financial assets from individuals. A review of historical incidents shows these types of automated lending decision systems may discriminate unfairly based on sex.
Negative impact of credit score
A secondary harm that is somewhat unique to credit lending decisions is the long-term impact on an individual’s credit score. In the United States, a FICO credit score is a number between 300 and 850 that represents a customer’s creditworthiness. An applicant’s credit score is used by many financial institutions for lending decisions. An applicant’s credit score usually increases after a successful repayment of a loan and decreases if the applicant fails to repay the loan.
When applying for a credit loan, there are three major outcomes:
The individual receives the credit loan and pays back the loan. In this scenario, we expect the individual’s credit score to increase as a result of the successful repayment of the loan.
The individual receives the credit loan but defaults on the loan. In this scenario, the individual’s credit score will drop drastically due to the failure to repay the loan. In the modeling process, this outcome is tied to a false negative (the model predicts the individual will repay the loan, but the individual is unsuccessful in doing so).
In certain countries, such as the United States, an individual receives a small drop (up to five points) to their credit score after a lender performs a hard inquiry on the applicant’s credit history. If the applicant applies for a loan but does not receive it, the small decrease in their credit score will impact their ability to successfully apply for a future loan. In the modeling process, this outcome is tied to the selection rate (the proportion of positive predictions outputted by the model).
Prevention of wealth accumulation
One other type of harm we anticipate in this scenario is the long-term effects of denying loans to applicants who would have successfully paid back the loan. By receiving a loan, an applicant is able to purchase a home, start a business, or pursue some other economic activity that they are not able to do otherwise. These outcomes are tied to false positive error rates in which the model predicts an applicant will default on the loan, but the individual would have successfully paid the loan back. In the United States, the practice of redlining [6], denying mortgage loans and other financial services to predominantly Black or other minority communities, has resulted in a vast racial wealth gap between white and Black Americans. Although the practice of redlining was banned in 1968 with the Fair Housing Act, the long-term impact of these practices [7] is reflected in the lack of economic investment in Black communities, and Black applicants are denied loans at a higher rate compared to white Americans.
Define fairness metrics based on harms#
Now that we have identified the relevant harms we anticipate users will experience, we can define our fairness metrics. In addition to the metrics, we will quantify the uncertainty around each metric using custom functions to compute the standard error for each metric at the \(\alpha=0.95\) confidence level.
def compute_error_metric(metric_value, sample_size):
    """Compute standard error of a given metric based on the assumption of
    normal distribution.

    Parameters:
    metric_value: Value of the metric
    sample_size: Number of data points associated with the metric

    Returns:
    The standard error of the metric
    """
    metric_value = metric_value / sample_size
    return 1.96 * np.sqrt(metric_value * (1.0 - metric_value)) / np.sqrt(sample_size)


def false_positive_error(y_true, y_pred):
    """Compute the standard error for the false positive rate estimate."""
    tn, fp, fn, tp = confusion_matrix(y_true, y_pred).ravel()
    return compute_error_metric(fp, tn + fp)


def false_negative_error(y_true, y_pred):
    """Compute the standard error for the false negative rate estimate."""
    tn, fp, fn, tp = confusion_matrix(y_true, y_pred).ravel()
    return compute_error_metric(fn, fn + tp)


def balanced_accuracy_error(y_true, y_pred):
    """Compute the standard error for the balanced accuracy estimate."""
    fpr_error, fnr_error = false_positive_error(y_true, y_pred), false_negative_error(
        y_true, y_pred
    )
    return np.sqrt(fnr_error**2 + fpr_error**2) / 2


fairness_metrics = {
    "count": count,
    "balanced_accuracy": balanced_accuracy_score,
    "balanced_acc_error": balanced_accuracy_error,
    "selection_rate": selection_rate,
    "false_positive_rate": false_positive_rate,
    "false_positive_error": false_positive_error,
    "false_negative_rate": false_negative_rate,
    "false_negative_error": false_negative_error,
}
Select a subset of metrics to report to avoid information overload
metrics_to_report = [
    "balanced_accuracy",
    "false_positive_rate",
    "false_negative_rate",
]
To compute the disaggregated performance metrics, we will use the
MetricFrame object within the Fairlearn library. We will pass in our
dictionary of metrics fairness_metrics, along with our test labels y_test
and test predictions Y_pred. In addition, we pass in the
sensitive_features A_test to disaggregate our model results.
Instantiate the MetricFrame for the unmitigated model
metricframe_unmitigated = MetricFrame(
    metrics=fairness_metrics,
    y_true=y_test,
    y_pred=Y_pred,
    sensitive_features=A_test,
)

metricframe_unmitigated.by_group[metrics_to_report]

metricframe_unmitigated.difference()[metrics_to_report]

metricframe_unmitigated.overall[metrics_to_report]
balanced_accuracy      0.801682
false_positive_rate    0.207656
false_negative_rate    0.188980
dtype: float64
def plot_group_metrics_with_error_bars(metricframe, metric, error_name):
    """Plot the disaggregated metric for each group with an associated
    error bar. Both metric and the error bar are provided as columns in the
    provided MetricFrame.

    Parameters
    ----------
    metricframe : MetricFrame
        The MetricFrame containing the metrics and their associated
        uncertainty quantification.
    metric : str
        The metric to plot
    error_name : str
        The associated standard error for each metric in metric

    Returns
    -------
    Matplotlib Plot of point estimates with error bars
    """
    grouped_metrics = metricframe.by_group
    point_estimates = grouped_metrics[metric]
    error_bars = grouped_metrics[error_name]
    lower_bounds = point_estimates - error_bars
    upper_bounds = point_estimates + error_bars

    x_axis_names = [str(name) for name in error_bars.index.to_flat_index().tolist()]
    plt.vlines(
        x_axis_names,
        lower_bounds,
        upper_bounds,
        linestyles="dashed",
        alpha=0.45,
    )
    plt.scatter(x_axis_names, point_estimates, s=25)
    plt.xticks(rotation=0)
    y_start, y_end = np.round(min(lower_bounds), decimals=2), np.round(
        max(upper_bounds), decimals=2
    )
    plt.yticks(np.arange(y_start, y_end, 0.05))
    plt.ylabel(metric)
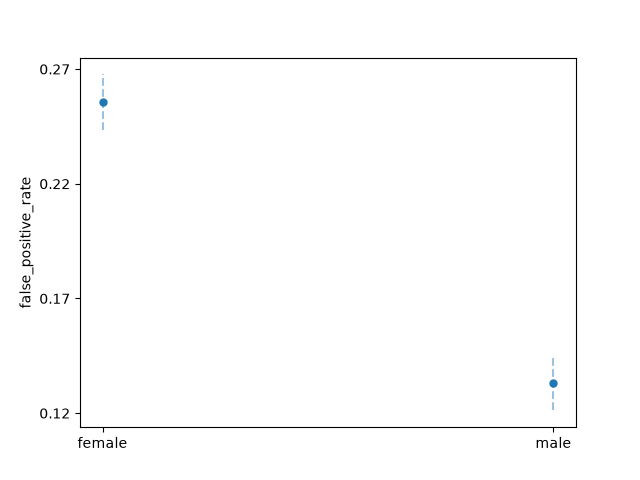
plot_group_metrics_with_error_bars(
    metricframe_unmitigated, "false_positive_rate", "false_positive_error"
)
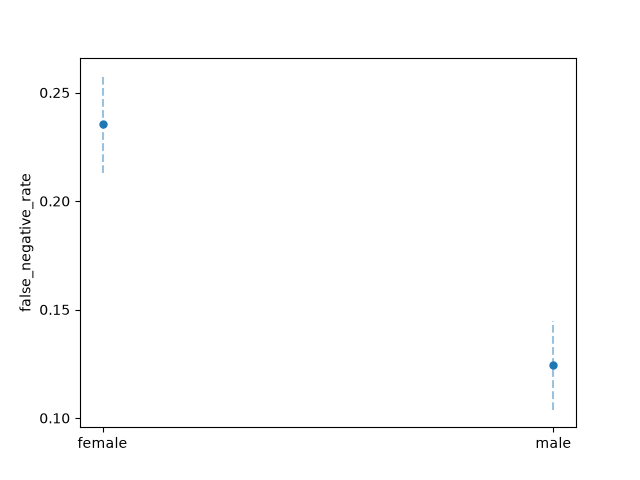
plot_group_metrics_with_error_bars(
    metricframe_unmitigated, "false_negative_rate", "false_negative_error"
)
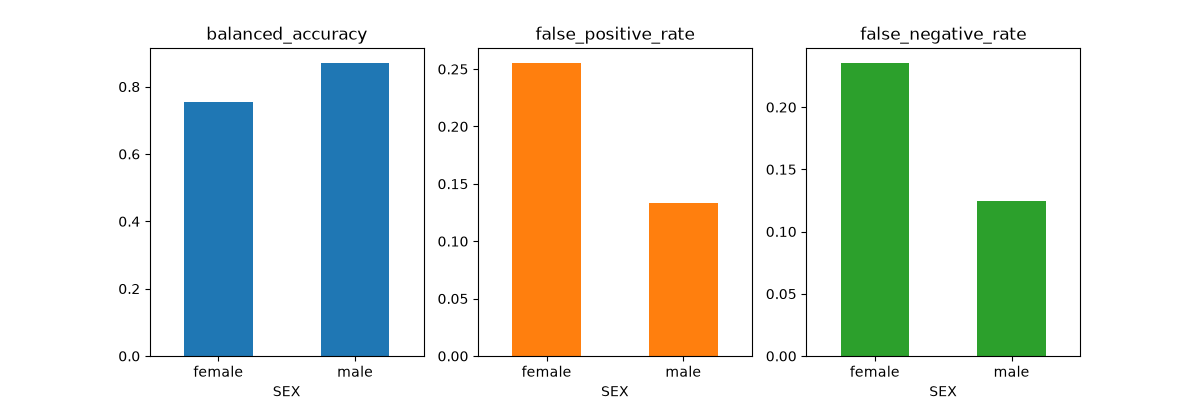
metricframe_unmitigated.by_group[metrics_to_report].plot.bar(
    subplots=True, layout=[1, 3], figsize=[12, 4], legend=None, rot=0
)
array([[<Axes: title={'center': 'balanced_accuracy'}, xlabel='SEX'>,
        <Axes: title={'center': 'false_positive_rate'}, xlabel='SEX'>,
        <Axes: title={'center': 'false_negative_rate'}, xlabel='SEX'>]],
      dtype=object)
Finally, let’s compute the equalized_odds_difference for this unmitigated
model. The equalized_odds_difference is the maximum of the
false_positive_rate_difference and false_negative_rate_difference. In our
lending context, both false_negative_rate_disparities and
false_positive_rate_disparities result in fairness-related harms. Therefore,
we attempt to minimize both of these metrics by minimizing the
equalized_odds_difference.
balanced_accuracy_unmitigated = balanced_accuracy_score(y_test, Y_pred)
equalized_odds_unmitigated = equalized_odds_difference(y_test, Y_pred, sensitive_features=A_test)
One key assumption here is we assume that false positives and false negatives have the equally adverse costs to each group. In practice, we would develop some weighting mechanism to assign a weight to each false negative and false positive event.
Mitigating Unfairness in ML models#
In the previous section, we identified disparities in the model’s
performance with respect to SEX. In particular, we found that model produces
a significantly higher false_negative_rate and false_positive_rate for the
applicants labeled female compared to those labeled male. In the context
of credit decision scenario, this means the model under-allocates loans to
women who would have paid the loan, but over-allocates loans to women who
go on to default on their loan.
In this section, we will discuss strategies for mitigating the performance disparities we found in our unmitigated model. We will apply two different mitigation strategies:
Postprocessing: In the postprocessing approach, the outputs of a trained classifier are transformed to satisfy some fairness criterion.
Reductions: In the reductions approach, we take in a model class and iteratively create a sequence of models that optimize some fairness constraint. Compared to the postprocessing approach, the fairness constraint is satisfied during the model training time rather than afterwards.
Postprocessing mitigations: ThresholdOptimizer#
In the Fairlearn package, postprocessing mitigation is offered through
the ThresholdOptimizer algorithm, following
Hardt, Price, and Srebro[8].
The ThresholdOptimizer takes in an existing (possibly pre-fit)
machine learning model whose predictions acts as a scoring function to
identify separate thresholds for each sensitive feature group.
The ThresholdOptimizer optimizes a specified objective metric
(in our case, balanced_accuracy) subject to some fairness constraint
(equalized_odds), resulting in a thresholded version of the underlying
machine learning model.
To instantiate our ThresholdOptimizer, we need to specify our fairness
constraint as a model parameter. Because both false_negative_rate
disparities and false_positive_rate disparities translate into real-world
harms in our scenario, we will aim to minimize the equalized_odds difference
as our fairness constraint.
postprocess_est = ThresholdOptimizer(
    estimator=estimator,
    constraints="equalized_odds",  # Optimize FPR and FNR simultaneously
    objective="balanced_accuracy_score",
    prefit=True,
    predict_method="predict_proba",
)
One key limitation of the ThresholdOptimizer is the need for sensitive
features during training and prediction time. If we do not have access to the
sensitive_features during prediction time, we cannot use the
ThresholdOptimizer.
We pass in A_train to the fit function with the
sensitive_features parameter.
postprocess_est.fit(X=X_train, y=y_train, sensitive_features=A_train)

postprocess_pred = postprocess_est.predict(X_test, sensitive_features=A_test)

postprocess_pred_proba = postprocess_est._pmf_predict(X_test, sensitive_features=A_test)
Fairness assessment of postprocessing model#
def compare_metricframe_results(mframe_1, mframe_2, metrics, names):
    """Concatenate the results of two MetricFrames along a subset of metrics.

    Parameters
    ----------
    mframe_1: First MetricFrame for comparison
    mframe_2: Second MetricFrame for comparison
    metrics: The subset of metrics for comparison
    names: The names of the selected metrics

    Returns
    -------
    MetricFrame : MetricFrame
        The concatenation of the two MetricFrames, restricted to the metrics
        specified.

    """
    return pd.concat(
        [mframe_1.by_group[metrics], mframe_2.by_group[metrics]],
        keys=names,
        axis=1,
    )
bal_acc_postprocess = balanced_accuracy_score(y_test, postprocess_pred)
eq_odds_postprocess = equalized_odds_difference(
    y_test, postprocess_pred, sensitive_features=A_test
)

metricframe_postprocess = MetricFrame(
    metrics=fairness_metrics,
    y_true=y_test,
    y_pred=postprocess_pred,
    sensitive_features=A_test,
)

metricframe_postprocess.overall[metrics_to_report]

metricframe_postprocess.difference()[metrics_to_report]
balanced_accuracy      0.019392
false_positive_rate    0.002971
false_negative_rate    0.035814
dtype: float64
Now, let’s compare the performance of our thresholded classifier with the original unmitigated model.
compare_metricframe_results(
metricframe_unmitigated,
metricframe_postprocess,
metrics=metrics_to_report,
names=["Unmitigated", "PostProcess"],
)
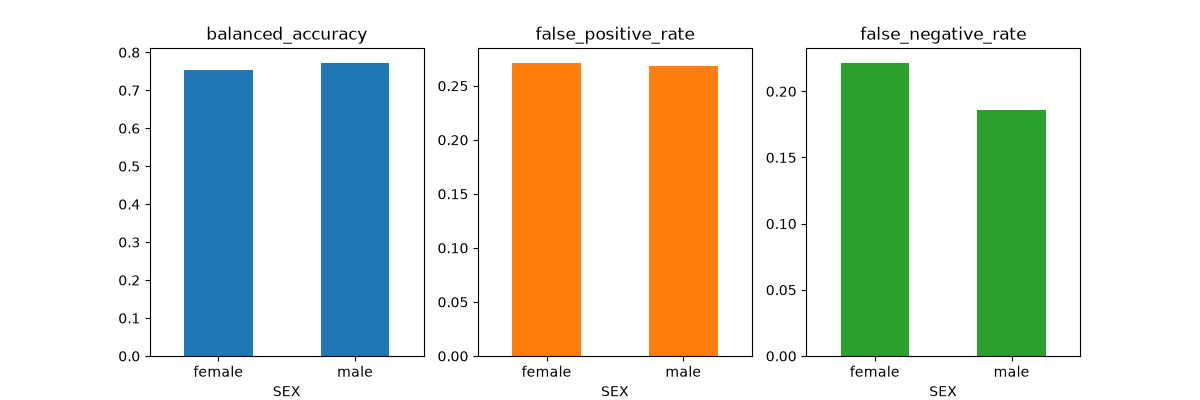
metricframe_postprocess.by_group[metrics_to_report].plot.bar(
subplots=True, layout=[1, 3], figsize=[12, 4], legend=None, rot=0
)
array([[<Axes: title={'center': 'balanced_accuracy'}, xlabel='SEX'>,
        <Axes: title={'center': 'false_positive_rate'}, xlabel='SEX'>,
        <Axes: title={'center': 'false_negative_rate'}, xlabel='SEX'>]],
      dtype=object)
We see that the ThresholdOptimizer algorithm achieves a much lower
disparity between the two groups compared to the unmitigated model.
However, this does come with the trade-off that the
ThresholdOptimizer achieves a lower balanced_accuracy score
for male applicants.
Reductions approach to unfairness mitigation#
In the previous section, we took a fairness-unaware model and used the
ThresholdOptimizer to transform the model’s decision boundary to
satisfy our fairness constraints.
One key limitation of the ThresholdOptimizer is needing access to
our sensitive_feature during prediction time.
In this section, we will use the reductions approach of Agarwal et. al (2018) [9] to produce models that satisfy the fairness constraint without needing access to the sensitive features at deployment time.
The main reduction algorithm in Fairlearn is ExponentiatedGradient.
The algorithm creates a sequence of re-weighted datasets and retrains the
wrapped classifier on each of the datasets.
This re-training process is guaranteed to find a model that satisfies the
fairness constraints while optimizing the performance metric.
The model returned by ExponentiatedGradient consists of several inner
models, returned by a wrapped estimator.
To instantiate an ExponentiatedGradient model, we pass in two
parameters:
a base
estimator(object that supports training)fairness
constraints(object of typefairlearn.reductions.Moment)
When passing in a fairness constraint as a Moment, we can specify
an epsilon value representing the maximum allowed difference or ratio
between our largest and smallest value.
For example, in the below code,
EqualizedOdds(difference_bound=epsilon) means that we are using
EqualizedOdds as our fairness constraint, and we will allow a
maximal difference of epsilon between our largest and smallest
equalized odds value.
def get_expgrad_models_per_epsilon(estimator, epsilon, X_train, y_train, A_train):
    """Instantiate and train an ExponentiatedGradient model on the
    balanced training dataset.

    Parameters
    ----------
    Estimator: Base estimator to contains a fit and predict function.
    Epsilon: Float representing maximum difference bound for the fairness Moment constraint

    Returns
    -------
    Predictors
        List of inner model predictors learned by the ExponentiatedGradient
        model during the training process.

    """
    exp_grad_est = ExponentiatedGradient(
        estimator=estimator,
        sample_weight_name="classifier__sample_weight",
        constraints=EqualizedOdds(difference_bound=epsilon),
    )
    # Is this an issue - Re-runs
    exp_grad_est.fit(X_train, y_train, sensitive_features=A_train)
    predictors = exp_grad_est.predictors_
    return predictors
Because the performance-fairness trade-off learned by the
ExponentiatedGradient model is sensitive to our chosen
epsilon value, we can treat epsilon as a hyperparameter
and iterate over a range of potential values.
Here, we will train two ExponentiatedGradient models, one with
epsilon=0.01 and the second with epsilon=0.02, and store the
inner models learned through each of the training processes.
In practice, we recommend choosing smaller values of epsilon on
the order of the square root of the number of samples in the training
dataset:
\(\dfrac{1}{\sqrt{\text{numberSamples}}} \approx \dfrac{1}{\sqrt{25000}} \approx 0.01\)
epsilons = [0.01, 0.02]
for epsilon, models in all_models.items():
    print(f"For epsilon {epsilon}, ExponentiatedGradient learned {len(models)} inner models")
For epsilon 0.01, ExponentiatedGradient learned 17 inner models
For epsilon 0.02, ExponentiatedGradient learned 19 inner models
Here, we can see all the inner models learned for each value of
epsilon.
With the ExponentiatedGradient model, we specify an epsilon
parameter that represents the maximal disparity in our fairness metric that
our final model should satisfy.
For example, an epsilon=0.02 means that the training value of the
equalized odds difference of the returned model is at most 0.02
(if the algorithm converges).
Reviewing inner models of ExponentiatedGradient#
In many situations due to regulation or other technical restrictions, the
randomized nature of ExponentiatedGradient algorithm may be
undesirable.
In addition, the multiple inner models of the algorithm introduce challenges
for model interpretability.
One potential workaround to avoid these issues is to select one of the inner
models and deploy it instead.
In the previous section, we trained multiple ExponentiatedGradient
models at different epsilon levels and collected all the inner
models learned by this process.
When picking a suitable inner model, we consider trade-offs between
our two metrics of interest: balanced error rate and equalized odds difference.
Since our focus is on these two metrics, we will filter out
the models that are outperformed in both of the metrics by some other
model (we refer to these as “dominated” models), and plot just the remaining
“undominated” models.
def is_pareto_efficient(points):
    """Filter a NumPy Matrix to remove rows that are strictly dominated by
    another row in the matrix. Strictly dominated means the all the row values
    are greater than the values of another row.

    Parameters
    ----------
    Points: NumPy array (NxM) of model metrics.
        Assumption that smaller values for metrics are preferred.

    Returns
    -------
    Boolean Array
        Nx1 boolean mask representing the non-dominated indices.
    """
    n, m = points.shape
    is_efficient = np.ones(n, dtype=bool)
    for i, c in enumerate(points):
        if is_efficient[i]:
            is_efficient[is_efficient] = np.any(points[is_efficient] < c, axis=1)
            is_efficient[i] = True
    return is_efficient
def filter_dominated_rows(points):
    """Remove rows from a DataFrame that are monotonically dominated by
    another row in the DataFrame.

    Parameters
    ----------
    Points: DataFrame where each row represents the summarized performance
            (balanced accuracy, fairness metric) of an inner model.

    Returns
    -------
    pareto mask: Boolean mask representing indices of input DataFrame that are not monotonically dominated.
    masked_DataFrame: DataFrame with dominated rows filtered out.

    """
    pareto_mask = is_pareto_efficient(points.to_numpy())
    return pareto_mask, points.loc[pareto_mask, :]
def aggregate_predictor_performances(predictors, metric, X_test, Y_test, A_test=None):
    """Compute the specified metric for all classifiers in predictors.
    If no sensitive features are present, the metric is computed without
    disaggregation.

    Parameters
    ----------
    predictors: A set of classifiers to generate predictions from.
    metric: The metric (callable) to compute for each classifier in predictor
    X_test: The data features of the testing data set
    Y_test: The target labels of the teting data set
    A_test: The sensitive feature of the testing data set.

    Returns
    -------
    List of performance scores for each classifier in predictors, for the
    given metric.
    """
    all_predictions = [predictor.predict(X_test) for predictor in predictors]
    if A_test is not None:
        return [metric(Y_test, Y_sweep, sensitive_features=A_test) for Y_sweep in all_predictions]
    else:
        return [metric(Y_test, Y_sweep) for Y_sweep in all_predictions]
def model_performance_sweep(models_dict, X_test, y_test, A_test):
    """Compute the equalized_odds_difference and balanced_error_rate for a
    given list of inner models learned by the ExponentiatedGradient algorithm.
    Return a DataFrame containing the epsilon level of the model, the index
    of the model, the equalized_odds_difference score and the balanced_error
    for the model.

    Parameters
    ----------
    models_dict: Dictionary mapping model ids to a model.
    X_test: The data features of the testing data set
    y_test: The target labels of the testing data set
    A_test: The sensitive feature of the testing data set.

    Returns
    -------
    DataFrame where each row represents a model (epsilon, index) and its
    performance metrics
    """
    performances = []
    for eps, models in models_dict.items():
        eq_odds_difference = aggregate_predictor_performances(
            models, equalized_odds_difference, X_test, y_test, A_test
        )
        bal_acc_score = aggregate_predictor_performances(
            models, balanced_accuracy_score, X_test, y_test
        )
        for i, score in enumerate(eq_odds_difference):
            performances.append((eps, i, score, (1 - bal_acc_score[i])))
    performances_df = pd.DataFrame.from_records(
        performances,
        columns=["epsilon", "index", "equalized_odds", "balanced_error"],
    )
    return performances_df
performance_df = model_performance_sweep(all_models, X_test, y_test, A_test)
performance_subset = performance_df.loc[:, ["equalized_odds", "balanced_error"]]
mask, pareto_subset = filter_dominated_rows(performance_subset)

performance_df_masked = performance_df.loc[mask, :]
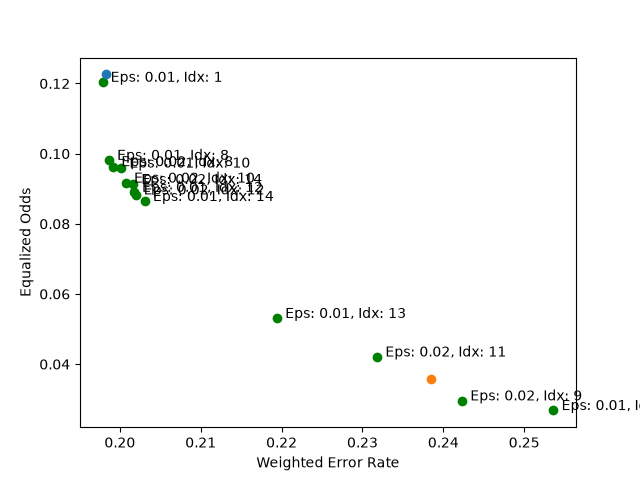
Now, let’s plot the performance trade-offs between all of our models.
for index, row in performance_df_masked.iterrows():
    bal_error, eq_odds_diff = row["balanced_error"], row["equalized_odds"]
    epsilon_, index_ = row["epsilon"], row["index"]
    plt.scatter(bal_error, eq_odds_diff, color="green", label="ExponentiatedGradient")
    plt.text(
        bal_error + 0.001,
        eq_odds_diff + 0.0001,
        f"Eps: {epsilon_}, Idx: {int(index_)}",
        fontsize=10,
    )
plt.scatter(
    1.0 - balanced_accuracy_unmitigated,
    equalized_odds_unmitigated,
    label="UnmitigatedModel",
)
plt.scatter(1.0 - bal_acc_postprocess, eq_odds_postprocess, label="PostProcess")
plt.xlabel("Weighted Error Rate")
plt.ylabel("Equalized Odds")
plt.legend(bbox_to_anchor=(1.85, 1))
<matplotlib.legend.Legend object at 0x7dbac0126540>
With the above plot, we can see how the performance of the non-dominated
inner models compares to the original unmitigated model. In many cases, we see
that a reduction in the equalized_odds_difference is accompanied by a small
increase in the weighted error rate.
Selecting a suitable inner model#
One strategy we can use to select a model is creating a threshold based
on the balanced error rate of the unmitigated model. Then out of the
filtered models, we select the model that minimizes the
equalized_odds_difference. The process can be broken down into the three
steps below:
Create threshold based on
balanced_errorof the unmitigated model.Filter only models whose
balanced_errorare below the threshold.Choose the model with smallest
equalized_oddsdifference.
Within the context of fair lending in the United States, if a financial
institution is found to be engaging in discriminatory behavior, they must
produce documentation that demonstrates the model chosen is the least
discriminatory model while satisfying profitability and other business needs.
In our approach, the business need of profitability is simulated by
thresholding based on the balanced_error rate of the unmitigated model, and
we choose the least discriminatory model based on the smallest
equalized_odds_difference value.
def filter_models_by_unmitigiated_score(
    all_models,
    models_frames,
    unmitigated_score,
    performance_metric="balanced_error",
    fairness_metric="equalized_odds",
    threshold=0.01,
):
    """Filter out models whose performance score is above the desired
    threshold. Out of the remaining model, return the models with the best
    score on the fairness metric.

    Parameters
    ----------
    all_models : Dictionary (Epsilon, Index) mapping (epilson, index number) pairs to a Model object
    models_frames : A DataFrame representing each model's performance and fairness score.
    unmitigated_score : The performance score of the unmitigated model.
    performance_metric : The model performance metric to threshold on.
    fairness_metric : The fairness metric to optimize for
    threshold : The threshold padding added to the :code:`unmitigated_score`.

    """
    # Create threshold based on balanced_error of unmitigated model and filter
    models_filtered = models_frames.query(
        f"{performance_metric} <= {unmitigated_score + threshold}"
    )
    best_row = models_filtered.sort_values(by=[fairness_metric]).iloc[0]
    # Choose the model with smallest equalized_odds difference
    epsilon, index = best_row[["epsilon", "index"]]
    return {
        "model": all_models[epsilon][index],
        "epsilon": epsilon,
        "index": index,
    }
best_model = filter_models_by_unmitigiated_score(
    all_models,
    models_frames=performance_df,
    unmitigated_score=(1.0 - balanced_accuracy_unmitigated),
    threshold=0.015,
)

print(
    f"Epsilon for best model: {best_model.get('epsilon')}, Index number: {best_model.get('index')}"
)
inprocess_model = best_model.get("model")
Epsilon for best model: 0.01, Index number: 14.0
Now we have selected our best inner model, let’s collect the model’s predictions on the test dataset and compute the relevant performance metrics.
metricframe_inprocess = MetricFrame(
    metrics=fairness_metrics,
    y_true=y_test,
    y_pred=y_pred_inprocess,
    sensitive_features=A_test,
)
metricframe_inprocess.difference()[metrics_to_report]
metricframe_inprocess.overall[metrics_to_report]
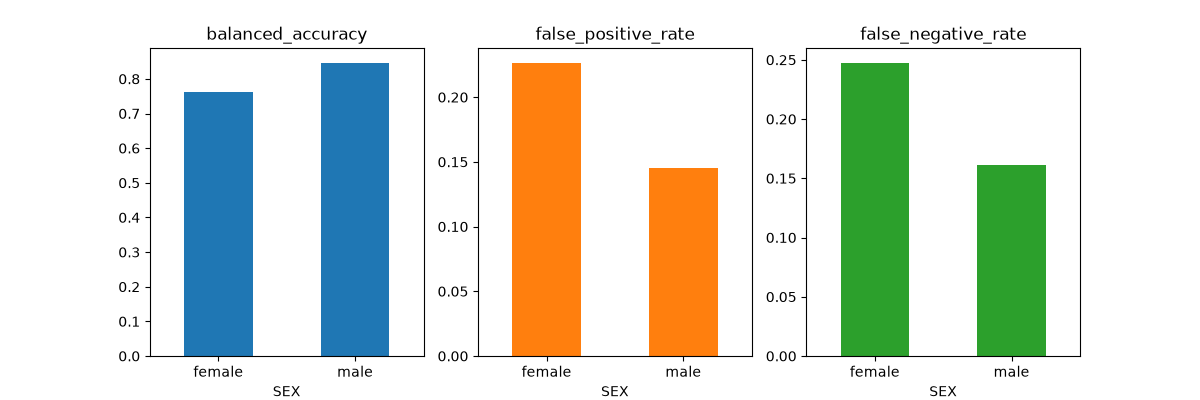
metricframe_inprocess.by_group[metrics_to_report].plot.bar(
subplots=True, layout=[1, 3], figsize=[12, 4], legend=None, rot=0
)
array([[<Axes: title={'center': 'balanced_accuracy'}, xlabel='SEX'>,
        <Axes: title={'center': 'false_positive_rate'}, xlabel='SEX'>,
        <Axes: title={'center': 'false_negative_rate'}, xlabel='SEX'>]],
      dtype=object)
Discuss Performance and Trade-Offs#
Now we have trained two different fairness-aware models using the postprocessing approach and the reductions approach. Let’s compare the performance of these models to our original fairness-unaware model.
metric_error_pairs = [
    ("balanced_accuracy", "balanced_acc_error"),
    ("false_positive_rate", "false_positive_error"),
    ("false_negative_rate", "false_negative_error"),
]


def create_metricframe_w_errors(mframe, metrics_to_report, metric_error_pair):
    mframe_by_group = mframe.by_group.copy()
    for metric_name, error_name in metric_error_pair:
        mframe_by_group[metric_name] = mframe_by_group[metric_name].apply(lambda x: f"{x:.3f}")
        mframe_by_group[error_name] = mframe_by_group[error_name].apply(lambda x: f"{x:.3f}")
        mframe_by_group[metric_name] = mframe_by_group[metric_name].str.cat(
            mframe_by_group[error_name], sep="±"
        )
    return mframe_by_group[metrics_to_report]
Report model performance error bars for metrics#
Unmitigated model
create_metricframe_w_errors(metricframe_unmitigated, metrics_to_report, metric_error_pairs)

metricframe_unmitigated.overall[metrics_to_report]
balanced_accuracy      0.801682
false_positive_rate    0.207656
false_negative_rate    0.188980
dtype: float64
ExponentiatedGradient model
create_metricframe_w_errors(metricframe_inprocess, metrics_to_report, metric_error_pairs)
ThresholdOptimizer
metricframe_inprocess.overall[metrics_to_report]

create_metricframe_w_errors(metricframe_postprocess, metrics_to_report, metric_error_pairs)

metricframe_postprocess.overall[metrics_to_report]
balanced_accuracy      0.761550
false_positive_rate    0.270270
false_negative_rate    0.206629
dtype: float64
We see both of our fairness-aware models yield a slight decrease in the balanced_accuracy for male applicants compared to our fairness-unaware model. In the reductions model, we see a decrease in the false positive rate for female applicants. This is accompanied by an increase in the false negative rate for male applicants. However overall, the equalized odds difference for the reductions models is lower than that of the original fairness-unaware model.
Conclusion and Discussion#
In this case study, we walked through the process of assessing a credit decision model for gender-related performance disparities. Our analysis follows closely the work done in the Microsoft/EY white paper [4] where they used the Fairlearn toolkit to perform an audit of a fairness-unaware tree-based model. We applied a postprocessing and reductions mitigation techniques to mitigate the equalized odds difference in our model.
Through the reductions process, we generated a model that reduces the equalized odds difference of the original model without a drastic increase in the balanced error score. If this were a real model being developed a financial institution, the balanced error score would be a proxy for the profitability of the model. By maintaining a relatively similar balanced error score, we’ve produced a model that preserves profitability to the firm while producing more fair and equitable outcomes for women in this scenario.
Designing a Model Card#
A key facet of Responsible Machine Learning is responsible documentation practices. Mitchell et al.[10] proposed the model card framework for documenting and reporting model training details and deployment considerations.
A model card contains sections for documenting training and evaluation dataset descriptions, ethical concerns, and quantitative evaluation summaries. In practice, we would ideally create a model card for our model before deploying it in production. Although we will not be producing a model card in this case study, interested readers can learn more about creating model cards using the Model Card Toolkit from the Fairlearn PyCon tutorial.
Fairness under unawareness#
When proving credit models are compliant with fair lending laws, practitoners may run into the issue of not having access to the sensitive demographic features. As a result, financial institutions are often tasked with proving their models are compliant with fair lending laws by imputing these demographics features. However, Chen et al.[11] show these imputation methods often introduce new fairness-related issues.
References#
Total running time of the script: (0 minutes 52.490 seconds)
Estimated memory usage: 200 MB